What's in a 409A Valuation Report and How to Read It
October 3, 2025
Aaron Yeung
You've been told you need a 409A, and a report has arrived. It’s dense, technical, and longer than you expected. That's because these reports are written for auditors and the IRS, not for the founders who receive them.
Still, the report matters. A 409A valuation sets the fair market value (FMV) of your company's common stock under Internal Revenue Code Section 409A. It determines the exercise price for every stock option grant you issue to employees as part of your equity compensation strategy. It also keeps your option grants compliant under Section 409A's deferred compensation rules.
This guide shows what's actually in a 409A report and how to read it. You'll see worked examples at different company stages that illustrate how assumptions, cap table data, and valuation methodology connect to shape your final number.
When do you need a new 409A?
A 409A valuation doesn't stay valid indefinitely. Missing the window, or failing to refresh after a material event, means any option grants issued in that gap fall outside IRS safe harbor. As a result, employees could owe immediate income tax on the discount plus a 20% penalty on those grants.
How long is a 409A valuation valid?
Most valuations are valid for 12 months from the valuation date, unless a material event occurs first. Once that window closes, you need a new valuation before issuing any additional grants, even if nothing else has changed in the business.
What triggers a 409A valuation refresh?
Certain events reset the clock regardless of when your last valuation was completed:
- Closing a new priced funding round
- A significant change in revenue or financial projections
- A material acquisition or asset transaction
- Market shifts that could meaningfully affect your company's fair market value
If any of these apply and you've issued grants without refreshing first, it's worth reviewing your situation with your legal or finance team.
How to read your 409A valuation report
A 409A valuation report can feel overwhelming at first glance. But when you know what to look for, it's much easier to tell whether the report is accurate, defensible, and audit-ready.
At a high level, a strong 409A report should clearly explain how the valuation firm reached its conclusions. You should expect to see:
- A clear methodology: The report should outline the approach the firm uses, such as option pricing methods or market-based comparisons, and explain why it's appropriate.
- Well-supported assumptions: Projections, discount rates, and exit scenarios should all tie back to reasonable, documented inputs.
- Cap table accuracy: The treatment of preferred vs. common stock, option pools, SAFEs, and warrants should match your actual ownership structure.
- Formulas behind the numbers: A defensible report shows not just the outcomes but how the firm arrived at them, with transparent calculations you can trace.
- Alignment with company events: The valuation should reflect your latest funding round, board actions, or other major milestones.
When these elements are present and well-documented, your report is much more likely to withstand an auditor or IRS review. If any of them seem vague, missing, or inconsistent, that's when it's worth digging deeper.
Red flags to avoid
Before diving in, it helps to know the common warning signs that a report might need closer scrutiny. Watch for these in your 409A report:
- Generic benchmarking: Using broad industry data instead of company-specific comparables or market approach analysis
- Missing key assumptions: Lack of clarity on revenue projections, discount rates, or exit scenarios
- No audit support: Absence of supporting schedules or documentation showing how an analyst calculates their numbers
- Unclear cap table treatment: Misaligned treatment of preferred vs. common stock or overlooked option pools
- Outdated data: Valuation not reflecting the latest funding round or significant company events
- Unnamed auditors: Reports that don't disclose who prepared or reviewed the analysis (lack of independent appraisal rigor)
- Proprietary "black box" methods: Use of opaque, non-auditable data or models that make it hard to defend the valuation in front of auditors or the IRS
Spotting these red flags keeps your 409A valuation solid and audit-ready. It's also a good reminder to think about related tax filings like the 83(b) election, which depend on having a defensible fair market value at the time of grant or exercise.
What auditors look for in your 409A valuation
Auditors want confidence that your company's valuation is complete, accurate, and defensible. They focus on making sure every part of the report can be traced and justified. Key elements include:
- Traceability of inputs: Every assumption should link back to documented sources, such as financial statements, investor agreements, or market data.
- Clear methodology: Shows exactly how an auditor calculates the valuation, including option pricing methods or PWERM analyses.
- Cap table accuracy: Audit-ready reports display ownership percentages, option pools, and instruments such as SAFEs and warrants, accurately reflecting actual ownership.
- Documented sensitivities: Reports should demonstrate how changes in key assumptions impact valuation outcomes and your financial health.
- Consistency with funding rounds: The valuation should reflect your most recent funding round and any board-approved equity changes, so auditors can see that the report accounts for new investments and the resulting ownership structure.
For more details on auditor expectations, see the IRS guidelines on Section 409A valuations and AICPA 409A valuation guidance.
Common 409A valuation mistakes founders make
The most common 409A mistakes happen quietly until something forces you to look closer. Here are the ones that catch founders off guard, and what actually happens when they do.
- Getting a valuation too late after a material event. New funding rounds, acquisitions, and significant revenue changes all count as material events. If you issue options before getting a fresh 409A, those grants fall outside IRS safe harbor. Most founders don't find out until an investor or auditor flags the problem during due diligence.
- Choosing a provider based on price alone. A defensible report has documented methodology, traceable assumptions, and a qualified independent third party standing behind the numbers. Automated or generic-benchmarking reports can look solid initially and crumble under IRS audits.
- Not reviewing the report before issuing options. If the cap table snapshot in your 409A valuation process doesn't match your current state, or if an assumption is off, those errors get embedded into every equity compensation grant you issue. Once those stock options are out, the tax risk falls to your employees.
- Using an outdated valuation for new grants. Your 409A is valid for 12 months unless a material event resets the clock. Issuing grants beyond that window leaves you outside safe harbor. Even if nothing has changed in the business, a stale valuation creates exposure.
- Failing to proactively surface your 409A in due diligence. When auditors and investors examine your company, your 409A documentation is part of their review. A clean report from a qualified provider is straightforward to hand over. One that raises questions about methodology or analyst credentials can slow the process and complicate a close.
Most of these mistakes trace back to the same root: a valuation that wasn't built to be reviewed. Work with a valuation team that gets it right the first time.
What a 409A valuation report contains and what each section means
Knowing a report exists and knowing what's in it are two different things. Understanding the structure of your 409A, what each section covers, and why it's there, makes it easier to spot gaps, ask the right questions, and confirm the report actually reflects your company accurately.
Every Pulley 409A valuation report is tailored to your company and valuation date. While the numbers and assumptions change, the structure is consistent. Below are the standard sections you'll find in our sample report.
1. Engagement overview and standard of value
The introductory section outlines the purpose of the valuation, explains the governing rules, and sets the legal and compliance foundation for the entire report. Key elements of the engagement overview include:
- Describing the valuation's purpose, such as tax compliance or ASC 718 reporting
- Defining fair market value and fair value under IRS and FASB guidance
- Citing the professional standards followed, including the AICPA Valuation Guide and audit requirements
Spelling out the standards up front gives auditors confidence that the report rests on a defensible basis.
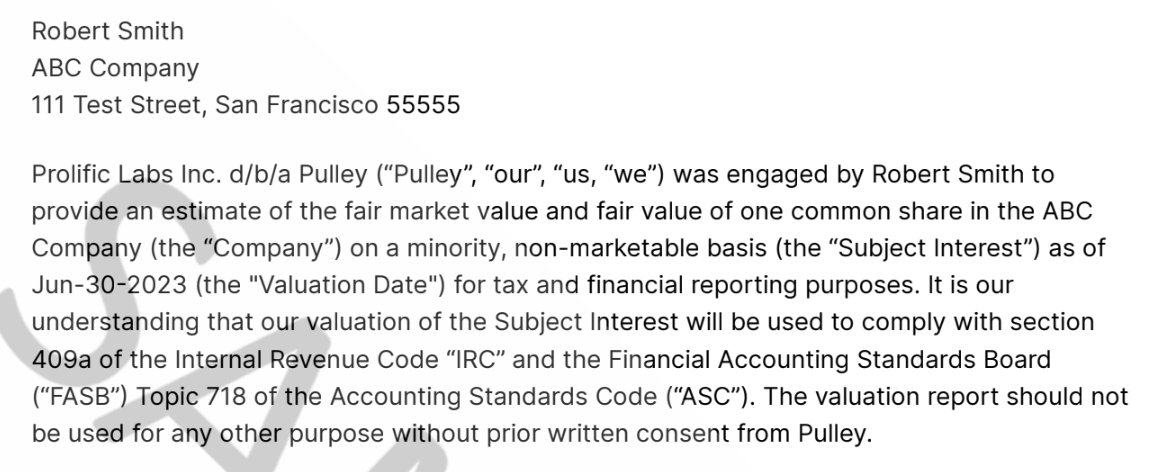
Sample introduction to the engagement overview
2. Summary
The summary provides a quick read showing where the valuation landed and presents the headline number and the core factors that drove it. Key elements of the summary include:
- The headline FMV of common stock
- A high-level methodology summary, such as guideline public company analysis, backsolve, or OPM
- The discount for lack of marketability (DLOM) applied to the stock
Together, these elements provide the at-a-glance takeaway for readers.
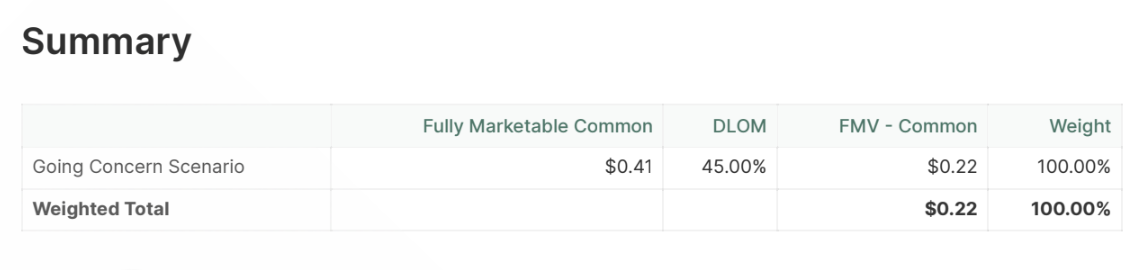
Sample FMV table for the summary
3. Company overview and cap table
A valuation always starts with a clear picture of the business itself. This section outlines the company's activities, its capital-raising efforts, and the ownership structure. Key elements of the company overview include:
- Description of your company's business model, recent fundraising, and strategic focus
- Summary of key risks and milestones
- Full cap table snapshot by share class, noting rights and preferences
- Basic financials, including balance sheet data, revenue, EBITDA, and projections
These details establish where the company stands on the date of valuation.
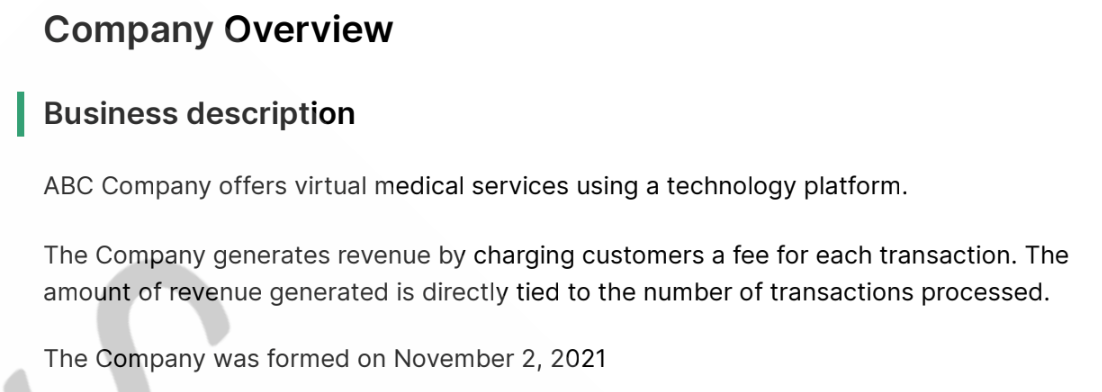
Sample business description for the company overview
4. Valuation analysis: Methodology discussion
Before showing numbers, the report explains which valuation approaches were considered and why. This explanation builds the foundation for the methods that were applied. Key elements of the valuation methodology include:
- Reviews of asset, market, and income approaches
- Specific methodologies, including guideline public company, precedent transactions, backsolve, and discounted cash flow
- The rationale for applying or excluding each method
Explaining these choices helps auditors and management understand the "why" behind the analysis.
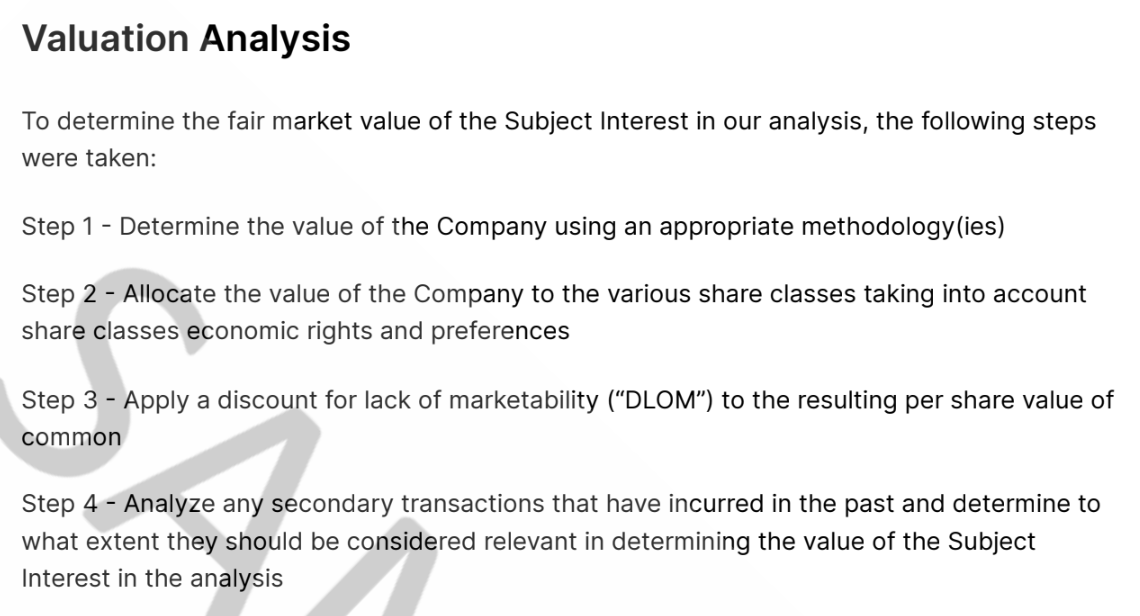
Sample methodology section for the valuation analysis
5. Valuation analysis: Method and supporting data
A valuation analysis should have an introduction to the data on which the report relies to calculate value. It lays out market evidence and financial comparisons to show how we selected the benchmarks. Key elements of the valuation methodology include:
- Market comps, multiples, and relative performance tables
- Your company's position regarding revenue and profitability comparisons
- Application of selected multiples to derive equity value
Here is where the underlying math begins to take shape.
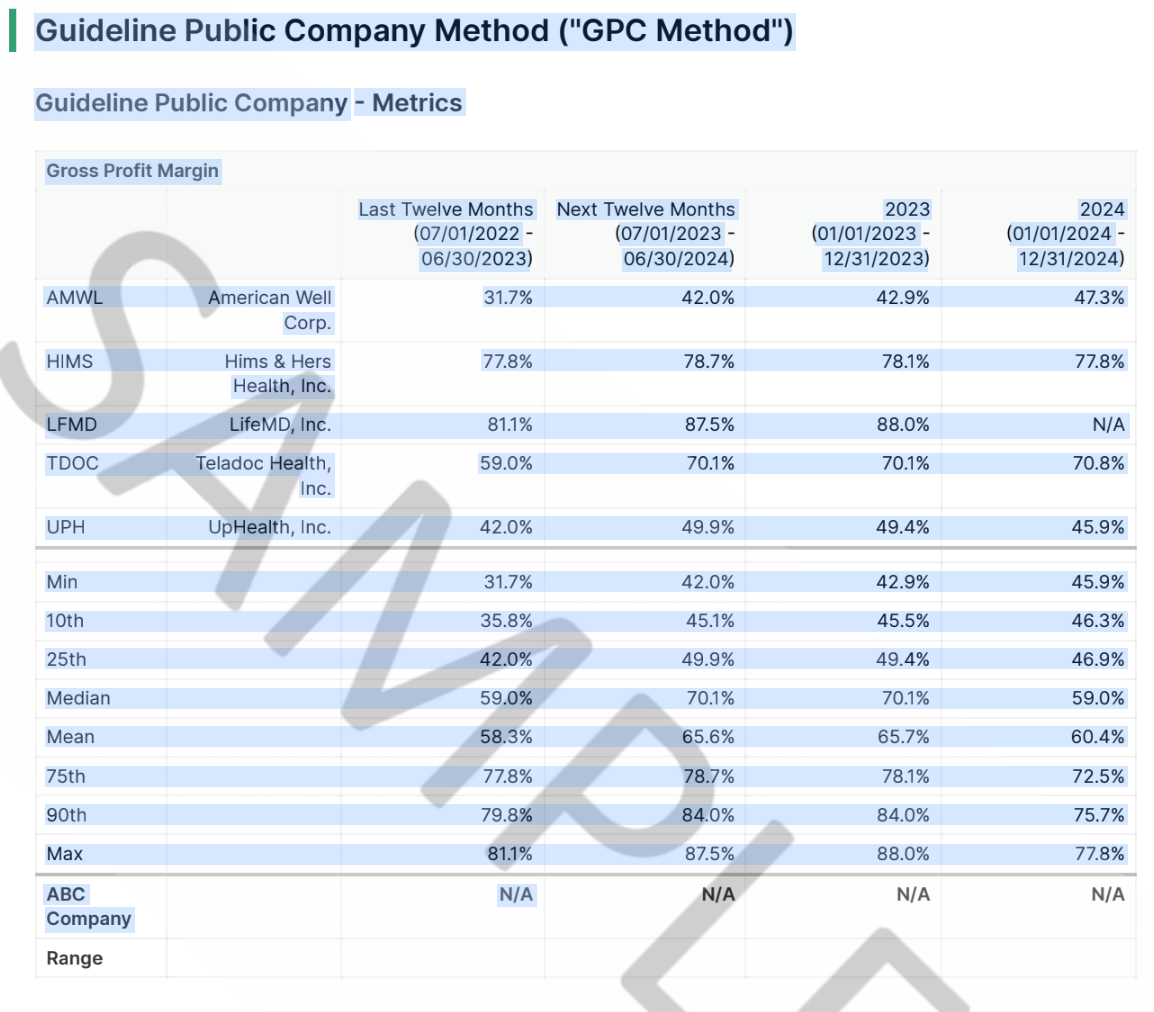
Sample methods section for the valuation analysis
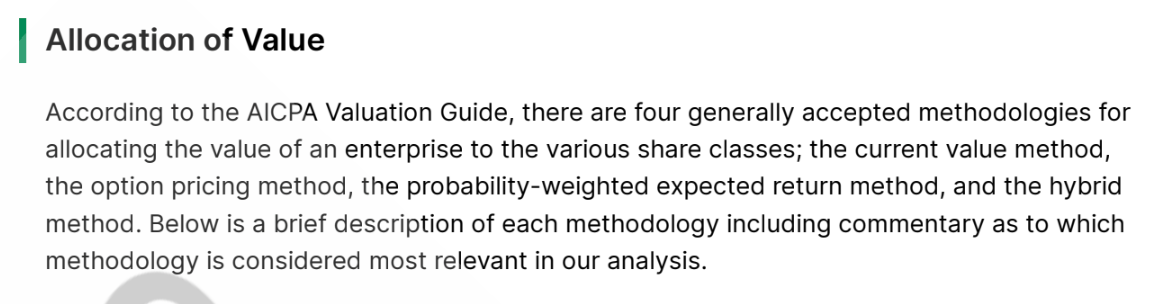
6. Valuation analysis: Allocation of value
Your analysis establishes total equity value, showing you how to divide that value among different securities. Key elements of the valuation allocation include:
- Allocation of total equity value across different securities
- Methods such as current value, OPM, PWERM, and hybrid
- Key inputs, including volatility, time to liquidity, and the risk-free rate
- Payout waterfalls and per-share outcomes in detail
This section illustrates how preferred stock, common stock, and options are affected differently by the valuation and how events like option pool refreshes or new funding can lead to share dilution.
Sample allocation of value section for the valuation analysis
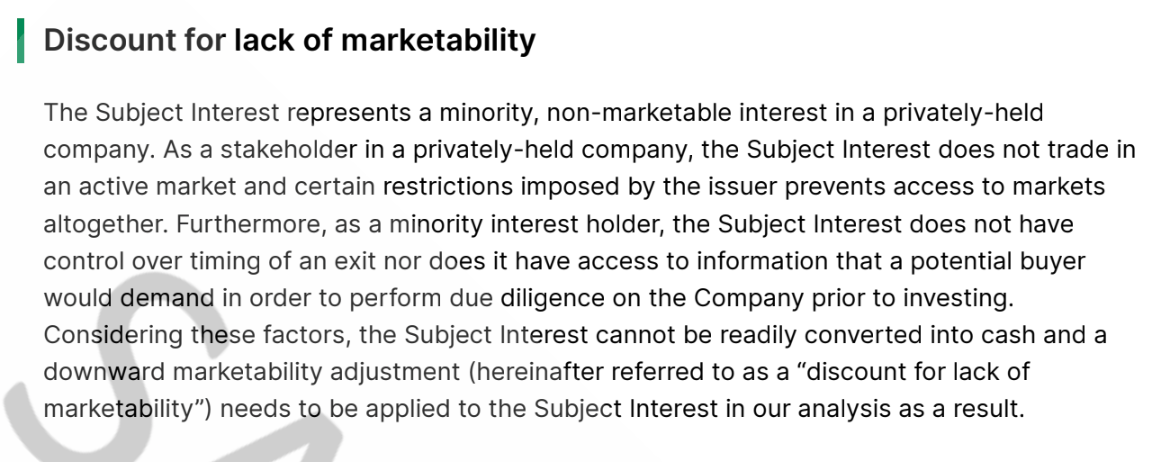
7. Valuation analysis: Discount for lack of marketability
Private company stock is less liquid than public stock, and this section accounts for that difference. Key elements of the valuation discount include:
- A rationale for a discount for lack of marketability (DLOM)
- Models such as put option methods and restricted stock studies
- The discount percentage and its supporting rationale
Applying this adjustment results in a more realistic fair market value for common stock.
Sample discount for lack of marketability section for the valuation analysis
8. Secondaries
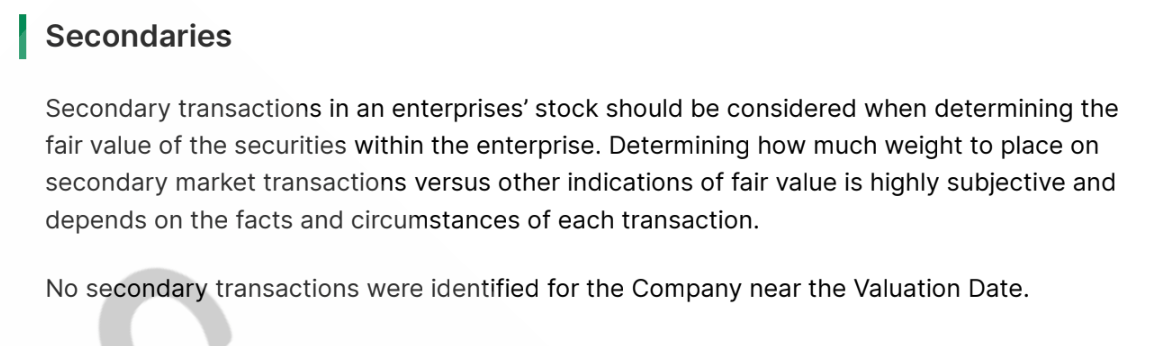
The second-to-last section explains why secondary stock sales are part of the valuation:
- The report reviews recent secondary transactions
- It notes whether those sales affect the concluded FMV
Even a brief look at secondary sales helps test whether the valuation aligns with real-world activity.
Sample secondaries section
9. Appendix
The appendix contains all supporting documentation needed to verify the report. It provides transparency into assumptions and calculations:
- Lists assumptions and limiting conditions
- Includes analyst bios and independence statements
- Provides economic and industry overviews
- Shares comparable company details
- Presents a full option pricing model and DLOM calculations
- Supporting exhibits and financials round out the analysis
This level of detail ensures every reader can trace any number in the report back to its source.
Taken together, these sections create a complete, audit-defensible record of how we determine your company's fair market value. A well-structured report keeps you compliant and gives investors, employees, and auditors confidence in the numbers.
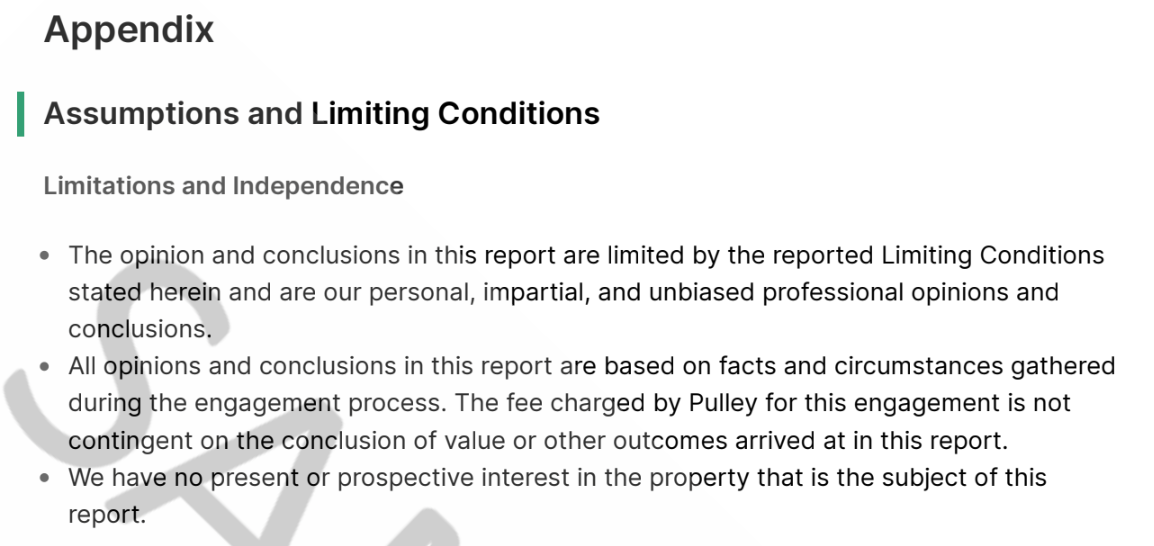
Sample Appendix for the valuation analysis
What happens when a 409A goes wrong
409A valuations can be tricky, and a poorly executed one can create real problems. The IRS can impose penalties for non-compliance, and because the valuation sets the strike price for every grant, an inaccurate one also feeds errors into your ASC 718 expense reporting.
Some providers rely solely on automated reports and generic benchmarking that ignore your company's unique situation. That approach can produce inaccurate valuations that don't hold up when it counts.
Key risks
A few common pitfalls can turn a 409A into a costly problem. Watch out for these consequences of a bad 409A:
- Potential IRS tax penalties and interest for non-compliance
- Mispriced options that can upset employees or investors
- Requirement to revise historical 409As after an audit
- Delays or complications in fundraising or initial public offerings (IPOs)
- Negative impact on financial reporting and equity accounting
These risks highlight why it's essential to work with experienced valuation experts and maintain accurate, defensible records.
How to fix it
If you discover issues in your current 409A, there are steps you can take to course-correct. Consider these options:
- Refresh your 409A valuation with updated data and methodology
- Communicate any changes clearly to employees and stakeholders
- Update option grants or equity awards to reflect corrected valuations
- Document your process to ensure audit readiness and compliance
- Work with an experienced valuation team to prevent future issues
How Pulley handles 409A valuations
Handling your 409A doesn't have to be stressful. Pulley helps you stay organized, transparent, and ready for any audit without the usual headaches.
In-house valuations, defended
Pulley's in-house valuations team handles your 409A with care, using proven methodologies and providing full audit support. Our reports clearly document the process, assumptions, and rationale behind each valuation.
In the rare event an auditor questions the 409A, we stand behind our work and defend it on your behalf. Pulley has completed more than 2,000 409A valuations with a 100% audit pass rate with Big 4 firms.
ASC 718 reporting in one place
Though separate from your 409A, ASC 718 reporting is critical for equity accounting and compliance. Pulley consolidates this process, reducing manual work and errors by pulling from your live cap table and grants. Audit-ready reports give finance teams confidence and streamline quarterly or annual reporting.
See your cap table in Pulley
Pulley's real-time cap table tools make it simple to manage ownership, model fundraising, and track grants. Everything stays up to date and organized, which supports a clean, audit-ready 409A report. The right cap table management software keeps your ownership data accurate enough that the 409A simply draws from it. That level of clarity benefits not just auditors but also your team and investors.
Try Pulley free with your own cap table data.
With Pulley, valuations, reporting, and cap table management all work together. You can focus on building your company with confidence, not just staying compliant.
Whether you're getting your first 409A or want a second opinion on an existing one, Pulley's valuation team has done 2,000+ with a 100% audit pass rate. Talk to the team.
409A valuation examples by company stage
The inputs and methodology behind a 409A valuation change significantly depending on where your company is in its growth. These examples show how valuation inputs and methodology vary by stage, from early-stage companies with SAFEs to mid-stage organizations with complex cap tables.
Our sample reports show how assumptions, cap tables, and valuation methods work together in real-world scenarios. They help you understand the process, but you should rely on a qualified third-party firm to conduct the actual valuation and maintain IRS safe harbor protection.
Example 1: Pre-revenue 409A valuation with SAFEs
Scenario: Early-stage startup with no revenue and multiple SAFE notes. Pulley uses the backsolve method to determine FMV.
This table gives a clear, rounded example of early-stage inputs for stock valuation at a business with multiple SAFEs.
Example 2: 409A valuation after a priced round
Scenario: Startup that recently closed a priced Series A. Pulley uses the Option Pricing Method (OPM) and accounts for board-approved terms and an option pool refresh.
This table shows the key inputs that drive the OPM. Small changes in any of these factors, like volatility or option pool size, can shift the resulting valuation.
Sensitivity table
Small shifts in key inputs can meaningfully change the value assigned to your shares. Sensitivity tables like this help founders and investors understand the range of potential outcomes and plan accordingly.
The table highlights how small changes in assumptions, like volatility, affect the fair market value.
Example 3: 409A valuation with a complex cap table
Scenario: Mid-market startup with multiple convertible notes, warrants, and preferred shares. Pulley uses the PWERM approach to model three outcomes: IPO, mergers and acquisitions (M&A), or staying private.
These inputs capture the complexity of a mid-market cap table and show how multiple instruments interact to affect common stock value. Assigning probabilities to each exit scenario helps model realistic outcomes and quantify risk.
PWERM outcome example
The PWERM outcome table illustrates how different exit events influence the fair market value of shares and the likelihood of each scenario. It provides a clear snapshot of how ownership and payouts would change under various company outcomes.
Modeling multiple outcomes helps founders and investors understand potential value ranges and make informed equity decisions.
Hybrid approach
PWERM for IPO/M&A + OPM for "stay private" illustrates how changes in probabilities or volatility affect the final FMV.
Documents to support reconciliation:
- Convertible note agreements
- Warrant agreements
- Board-approved financing term sheets
- Cap table history
- Financial statements
These examples show how Pulley handles every stage and complexity level, so your 409A report is both clear and audit-ready.
Board and auditor expectations
Boards and auditors typically ask about assumptions, comps, and methodology. Pulley's in-house team supports audits by providing clear documentation and defendable valuations. This transparency and guidance give you confidence every step of the way.
Pulley's in-house valuation team has completed more than 2,000 409As with a 100% audit pass rate. See how the process works, and get yours done right.
Switch to Pulley
Pulley simplifies equity management - Cap tables, 409a valuations, SBC reporting, scenario modeling, SAFEs, RSUs, options, and more.

By subscribing you agree to our Privacy Policy.